Five Years of Data Show: Our Street Safety Projects are Making a Difference

Five Years of Data Show: Our Street Safety Projects are Making a Difference
By Julia Malmo

Ever wonder about the effectiveness of projects after they go into the ground? Us, too!  

That’s why, in 2017, we launched the Safe Streets Evaluation Program to help project teams understand whether a transportation safety project’s design is effective, and where there might be opportunities to adjust the design if not. Project evaluation data can also be combined across projects to help the SFMTA track the effectiveness of a certain type of safety improvement, which can in turn streamline the design of future projects. The Safe Streets Evaluation Program helps us work towards achieving Vision Zero, an initiative to prioritize street safety and eliminate traffic deaths in San Francisco.  

This week, we’re looking back on five years of data gathered through our Safe Streets Evaluation Program with the “2022 Safe Streets Evaluation Summary,” an interactive website summarizing the results of 18 bicycle, pedestrian and traffic safety projects implemented since 2017. 

Each of the 18 projects evaluated in the summary report added significant safety upgrades to the streets. Some introduced vehicle travel lane removals (road diets), separated bikeways, separated bike signals, or left-turn traffic calming devices. Others brought general improvements for pedestrians at intersections including pedestrian signal improvements, daylighting (red zones at intersections) and upgraded crosswalks. For every project, the SFMTA drew on a wide range of data—from project-specific observations, to police reports, to speed data—to create a comprehensive view into its’ effectiveness. 
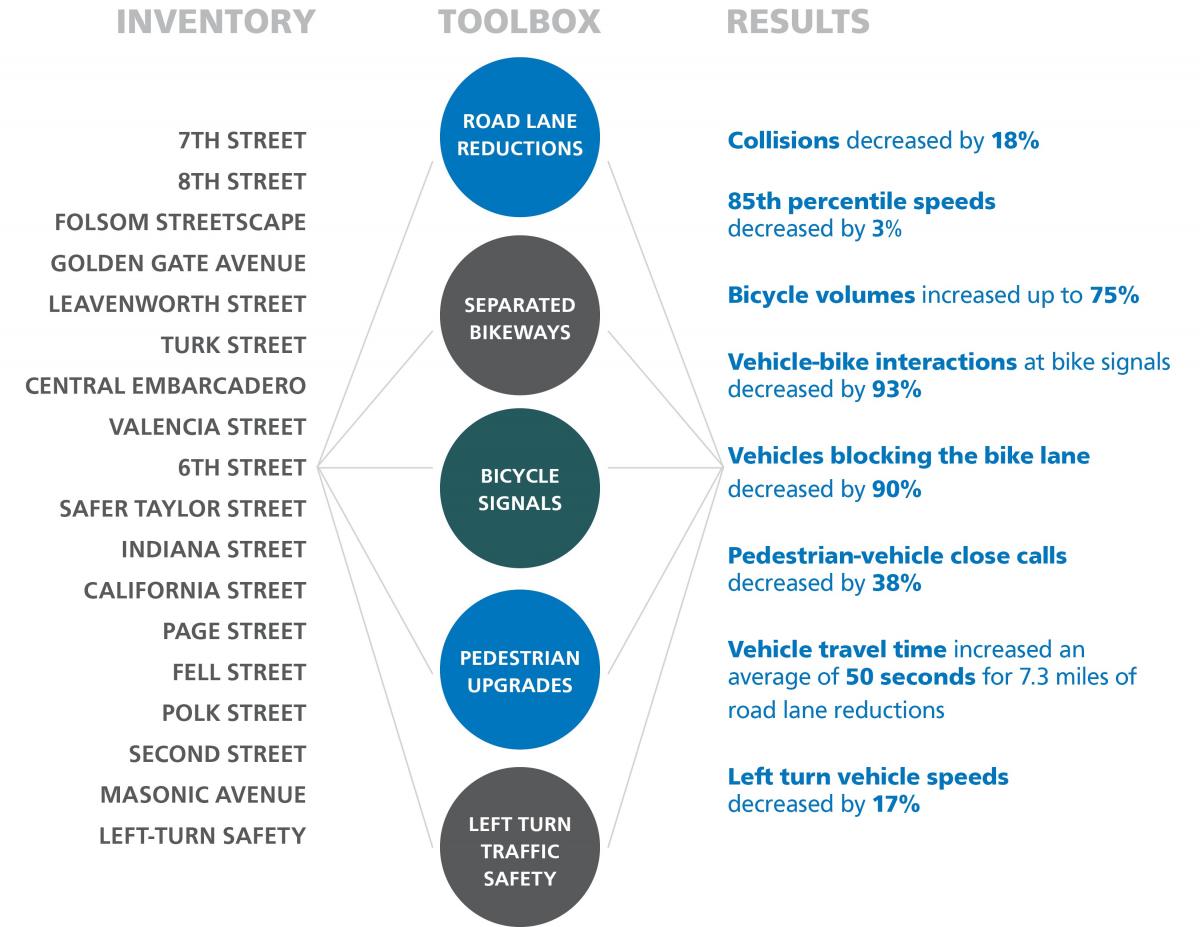
An infographic displaying the project names, key design element, and results. In the lefthand column, under “Inventory” the following projects are listed: 7th Street, 8th Street, Folsom Streetscape, Golden Gate Avenue, Leavenworth Street, Turk Street, Central Embarcadero, Valencia Street, 6th Street, Safer Taylor Street, Indiana Street, California Street, Page Street, Fell Street, Polk Street, Second Street, Masonic Avenue, Left-Turn Safety. In the center column, under “toolbox,” the following elements are listed: Road lane reductions, separated bikeways, bike signals, pedestrian upgrades, left-turn traffic safety. In the righthand column, under “results”, the following findings are listed: Collisions decreased by 18%; 85th percentile speeds decreased by 3%; bicycle volumes increased up to 75%; vehicle-bike interactions at signals decreased by 93%; vehicles blocking the bike lane decreased by 90%; pedestrian-vehicle close calls decreased by 38%; vehicle travel time increased an average of 50 seconds for 7.3 miles of road lane reductions; left turn vehicle speeds decreased by 17%

The evaluation report indicates that the SFMTA’s safety tools are working together to create safer environments for all modes of transportation on city streets. 

You can dig into the whole set of outcomes on the website, but here are some highlights:  

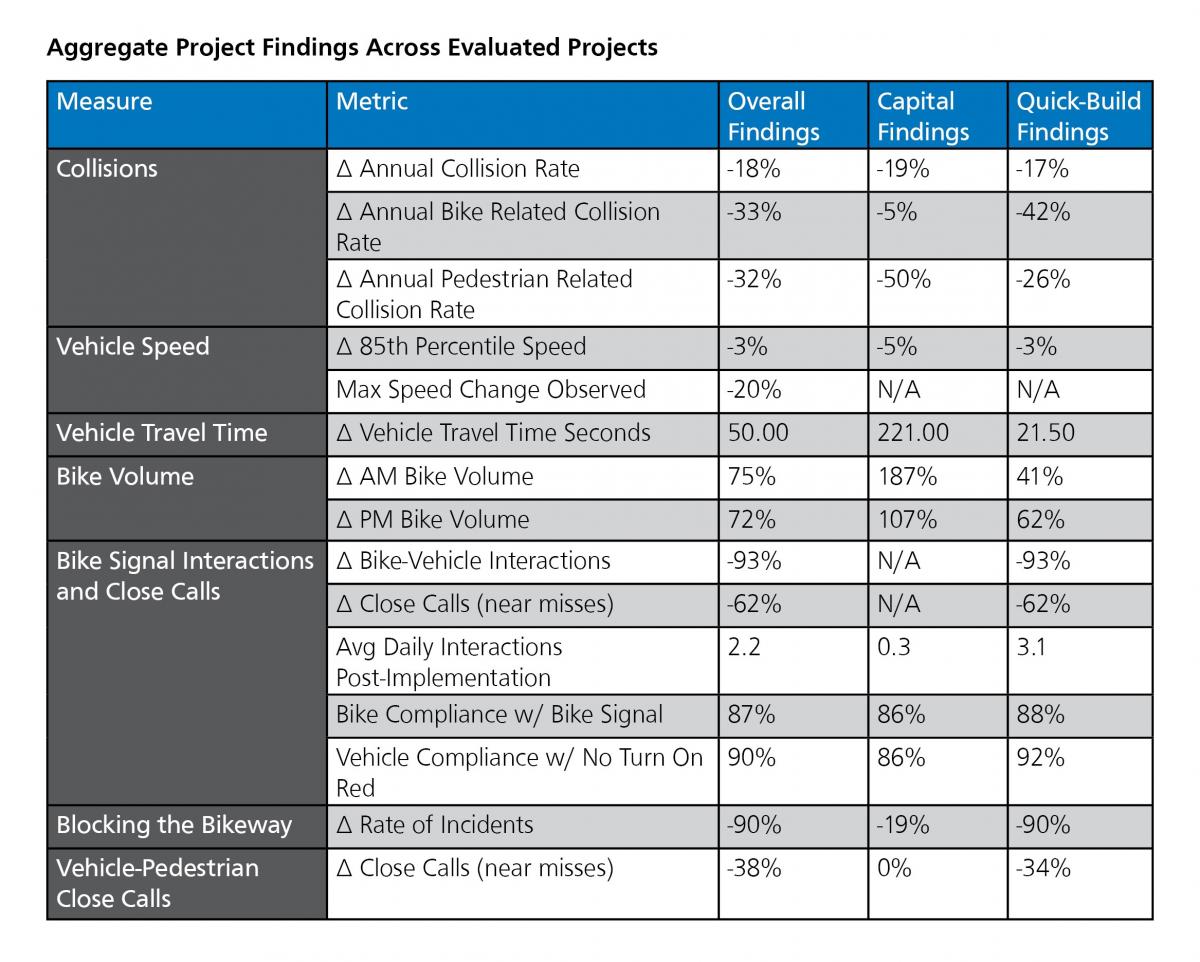
  • Within the projects evaluated, annual collision rates decreased by 18%  

  • Bicycle-related collision rates decreased by 33% and pedestrian-related collision rates decreased by 32%   

  • Bicycle volumes on streets that received bicycle improvements increased up to 75% in the morning peak (8 AM to 10 AM) commute times, with similar growth in the afternoon/evening peak (4 PM to 6 PM) commute times.   

  • Thanks to protected bikeways, the rate of incidents of vehicles blocking the bike lane decreased by 90%.   

  • Close calls or near misses between pedestrians and drivers decreased across evaluated projects by 38%.  

  • Several projects in under-served communities such as the Bayview and Tenderloin are helping to address historic inequities and under-investment in these neighborhoods.   A table titled “Aggregate Project Findings Across Evaluated Projects”. At the top of the table, a blue bar lists out the column titles: Measure; Metric; Overall Findings; Capital Findings; Quick-Build Findings. In the Collisions section, the following sub-categories are evaluated. For Annual Collision Rate: Overall findings show an 18% reduction; Capital Findings show a 19% reduction; Quick-Build Findings show a 17% reduction. For Annual Bike-related collision rate: Overall findings show a 33% reduction; Capital findings show a 5% reduction; Quick-Build findings show a 42% reduction. For Annual Pedestrian Related Collision Rates: Overall findings show a 32% reduction; Capital findings show a 50% reduction; Quick-Build findings show a 26% reduction. In the Vehicle Speed section, the following sub-categories are evaluated. For 85th Percentile Speed: Overall findings show a 3% reduction; Capital findings show a 5% reduction, and Quick-Build Findings show a 3% reduction. For Max Speed Change Observed: Overall findings show a 20% reduction, and no data is present for either Capital Findings or Quick-Build Findings. For Vehicle Travel Time/Vehicle Travel Time in Seconds: Overall findings show 50.00; Capital Findings show 221.00; Quick-Build Findings show 21.50. For the Bike Volume section, the following sub-categories are evaluated. For AM Bike Volumes: Overall Findings show a 75% increase; Capital Findings show a 187% increase; Quick-Build findings show a 41% increase. For PM Bike Volumes: Overall Findings show a 72% increase; Capital Findings show a 107% increase; Quick-Build Findings show a 62% increase. In the Bike Signal Interactions and Close Calls section, the following sub-categories are evaluated. For Bike-Vehicle interactions: Overall findings show a 93% reduction; Capital findings show no data; Quick-Build findings show a 93% reduction. For Close Calls (near misses): Overall findings show a 62% reduction; Capital findings show no data; Quick-Build findings show a 62% reduction. For Average Daily Interactions Post-Implementation: Overall Findings show 2.2; Capital Findings show 0.3; Quick-Build Findings show 3.1. For Bike Compliance w/ Bike Signal: Overall findings show 87% compliance; Capital Findings show 86%; Quick-Build Findings show 88% compliance. For Vehicle Compliance w/ No Turn On Red: Overall findings show 90% compliance; Capital Findings show 86% compliance; Quick-Build findings show 92% compliance. In the Blocking the Bikeway section, Rates of Incidents was evaluated. Overall Findings show a 90% reduction; Capital Findings show a 19% reduction; Quick-Build Findings show a 90% reduction. In the Vehicle-Pedestrian Close Calls Section, Close Calls (near misses) were evaluatd. Overall Findings show a 38% reduction; capital findings show a 0% reduction; quick-build findings show a 34% reduction
The Safe Streets Evaluation team will continue to think creatively about how to build on the evaluation work and use it to inform our current and future projects, programs, and practices through developing a publicly accessible database of all Safe Streets Evaluation data and finding better ways to evaluate project outreach efforts. 

View the 2022 Safe Streets Evaluation Summary 

Learn more about the SFMTA Safe Streets Evaluation Program: SFMTA.com\safestreetsevaluation 


Published November 08, 2022 at 04:26AM
https://ift.tt/jcWqtYF

Comments

Popular posts from this blog

Muni Plans to Reach 98 Percent of San Francisco this August

Muni Plans to Reach 98 Percent of San Francisco this August By Julie Kirschbaum In August 2021, 98% of residents and 100% of equity neighborhoods could be within a ¼ mile of a Muni stop Following major service restorations on May 15 , with the KT Ingleside-Third and N Judah Muni Metro rail service resuming, historic street cars returning and subways reopening, the SFMTA is already hard at work planning to restore even more service later this summer. This effort will potentially close almost all of the Muni service gaps across the city, bringing 98% of San Francisco within two to three blocks of a Muni stop. This August, pending the relaxation of pandemic protocols and physical distancing restrictions, the SFMTA is expecting to bring back more than a dozen bus routes that were temporarily suspended as part of pandemic-related service reductions at the beginning of the crisis, including: Route Restorations: 5R Fulton Rapid, 18 46th Avenue, 35 Eureka, 36 Teresita, 39 Coit  “...

A Brief History of the T Third Part 1: 1860-2007

A Brief History of the T Third Part 1: 1860-2007 By Jeremy Menzies Earlier this month, we launched free weekend shuttle service in the Central Subway . And come January 7th, our 4 new stations will connect directly to the rest of the T line from Sunnydale to Chinatown. Through this two-part blog series, we will look back at some of the history of the T from the 1860s to today! In Part One, we’ll look over the first 150 years from the 1860s to the 2000s. Next month in Part Two, we will take a closer look at the history of the T and Central Subway projects leading up to today’s service.  The Horsecar Era: 1860s-1890s  Starting in the 1860s, transit service along today’s T Line was provided by horsecars. These were small rail cars (that looked much like a cable car) that were pulled along tracks by horses. Two companies, the Omnibus Railroad and the North Beach & Mission Railway, operated horsecar lines on parts of the path of today’s T. These lines were mainly meant to ...

Explore Yerba Buena with New Central Subway Connections

Explore Yerba Buena with New Central Subway Connections By Christopher Ward Starting November 19, Central Subway opens for special service, allowing customers to experience the new Yerba Buena/Moscone Station. The new Yerba Buena/Moscone Station at 4th and Folsom streets along the Central Subway connects Muni customers with the communities and attractions in San Francisco’s South of Market district. The new station is located across the street from Yerba Buena Square and the Moscone Convention Center and steps away from hotels, museums, shopping and restaurants. However, you choose to spend your time in Yerba Buena, you’ll have no shortage of things to do. Interested in the arts and culture? Yerba Buena/Moscone Station is your stop! Explore the San Francisco Museum of Modern Art (SFMOMA), the Contemporary Jewish Museum, the Yerba Buena Center for the Arts, the Museum of the African Diaspora (MOAD), the American Bookbinder’s Museum or the Children’s Creativity Museum, all within a...

What a Year It Has Been! Let the Celebration of Transit Month Continue

What a Year It Has Been! Let the Celebration of Transit Month Continue By Erin McMillan 49 Van Ness/Mission using the brand new bus rapid transit lanes on opening day in April. During Transit Month this September, we’re continuing the celebration by looking back to more of the work we’ve done over the last year— some that has been less obvious to Muni customers, but critical to a well-functioning system and other work that is more front and center. Fix It! Week and Continuing State of good Repair Work Muni is an impressive transit system. Moving thousands of people on rail and buses every day takes a lot of coordination and a lot of work. Dealing with unique challenges like San Francisco’s geography and shifting travel patterns, we also have to deal with issues related to the Muni system’s age. Proper care and maintenance of a transit system many decades old takes strategic planning as regular maintenance needs to happen while continuing to provide service. Typically, regular Mun...

Three Golden Rules to Improve Scooter Safety

Three Golden Rules to Improve Scooter Safety By Mona Chiu The SFMTA has some exciting news for all who use the sidewalk in the city! Starting May 1, 2023, we'll be launching a new safety campaign to promote safe and responsible electric scooter use for both permitted scooter share devices and privately operated scooters. The campaign will focus on three key safety rules that every rider should keep in mind while riding: no sidewalk riding, no speeding and no double riding (two people riding one device). By educating riders about the dangers of sidewalk riding, unsafe speeding and riding, and improper parking, we hope to make the city safer for everyone.     Sidewalk riding has been a major concern for pedestrians in San Francisco, and it's illegal to ride an electric scooter on the sidewalk.     Electric scooters can travel at speeds of up to 15 miles per hour, which can be dangerous if riders aren't paying attention to their surroundings. The SFMTA's saf...

Muni’s Equity Toolkit Helps Essential Employees Get to Work

Muni’s Equity Toolkit Helps Essential Employees Get to Work By Mariana Maguire The latest data from SFMTA’s new  Equity Toolkit  shows that Muni service changes are helping people in neighborhoods identified by our  Muni Service Equity Strategy  access more jobs and support the city’s recovery.   In winter 2020, we launched the  SFMTA Equity Toolkit  to understand how service decisions are affecting neighborhoods where there is likely a high prevalence of essential workers who rely predominantly on Muni to get to their essential jobs. Our goal is to make better service decisions based on the trends and impacts we see in the Equity Toolkit.   Recently, the greatest increases in access to jobs via Muni have been in Hunters Point and Western Addition....

New top story from Time: New Zealand Votes To Legalize Euthanasia but Not Marijuana

https://ift.tt/3e9pK8J WELLINGTON, New Zealand — New Zealanders voted to legalize euthanasia in a binding referendum, but preliminary results released Friday showed they likely would not legalize marijuana. With about 83% of votes counted, New Zealanders emphatically endorsed the euthanasia measure with 65% voting in favor and 34% voting against. The “No” vote on marijuana was much closer, with 53% voting against legalizing the drug for recreational use and 46% voting in favor. That left open a slight chance the measure could still pass once all special votes were counted next week, although it would require a huge swing. In past elections, special votes — which include those cast by overseas voters — have tended to be more liberal than general votes, giving proponents of marijuana legalization some hope the measure could still pass. Proponents of marijuana legalization were frustrated that popular Prime Minister Jacinda Ardern wouldn’t reveal how she intended to vote ...

Youth Voices for Vision Zero SF

Youth Voices for Vision Zero SF By Christine Osorio Starting in the month of February, Muni buses and transit shelters will feature youth artwork illustrating Vision Zero traffic safety messages. The students are part of Youth Art Exchange (YAX), an arts-education non-profit based whose mission is to support San Francisco’s public high school students in becoming leaders, thinkers, and artists by sharing creative practices with professional artists. As part of Supervisor Norman Yee’s District 7 participatory budget process, YAX students consulted with SFMTA staff to develop traffic safety messages and artwork that reflect their experiences around traffic safety. Themes highlighted through Youth Voices for Vision Zero SF include general traffic safety such as: Yielding to pedestrians in the crosswalk. Slowing down. Understanding that traffic deaths are preventable. Watching for people biking. Not blocking the sidewalk with a scooter. The student artwork also included Covid-...

SFMTA Budget Priorities for FY 2023 to FY 2024

SFMTA Budget Priorities for FY 2023 to FY 2024 By Andrea Buffa It’s budget season!  Every two years, the SFMTA develops a consolidated budget to guide the agency’s decisions about where to focus our funding to best meet the transportation needs of all San Franciscans. We’re developing a budget that’s designed to support San Francisco’s economic recovery, increase transportation equity, protect the environment and keep the agency on sound financial footing.   We presented the base budget (projected revenues and expenditures for the next two years if we made no changes and continued our current policies) to our Board of Directors in early February to get their feedback and are now seeking input from the public. Your feedback will help us understand what to change in our base budget: which investments are most important to San Franciscans and which new revenue sources you think we should pursue. We’re considering both fare increases and decreases as well as changes to parkin...

Smarter Traffic Signals Prioritize Transit and People

Smarter Traffic Signals Prioritize Transit and People By Robert Lim Have you ever wondered how traffic signals could better balance the needs of all road users, whether driving, bicycling, walking or taking Muni? The SFMTA is rolling out its Connected Corridor Pilot this month to use transit platform and traffic signal sensor data to inform signal timing adjustments. The pilot also aims to collect information to support transit efficiency and street safety improvements.  Traffic engineers use signal timing adjustments as a tool to prioritize the flow of travel in specific directions or for different travel modes – Muni, people walking or driving – to meet the changing demands of the road network across different timepoints in a day. The Connected Corridors Pilot seeks to push the envelope of innovation by investing in advanced technologies, funded through a U.S. Department of Transportation (USDOT) grant. These tools will better position the city to serve the potential future ne...